The BizStream Solar Dashboard is an internal project created to show the BizStream team the impact of our solar panels in terms of how much money is being saved and their positive effect on the environment through real-time data.
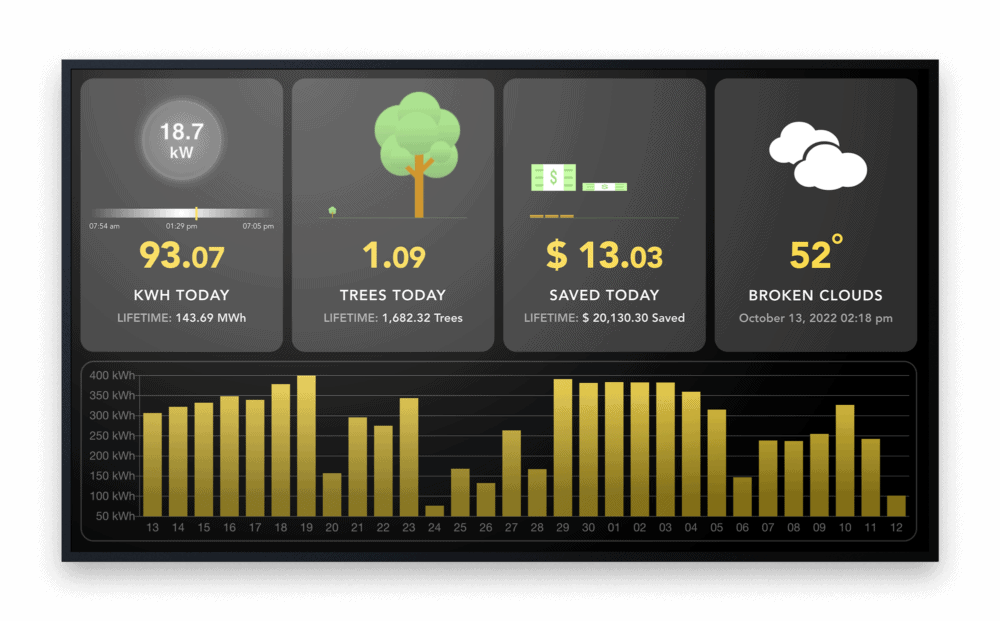
During a hackathon event, a team of one developer (Mark Schmidt) and one designer (Rex Rainey) challenged themselves to create a custom internal dashboard showing real-time data and historical stats from our rooftop solar panels.
Here are our stats as of this writing… and they’re increasing every day!
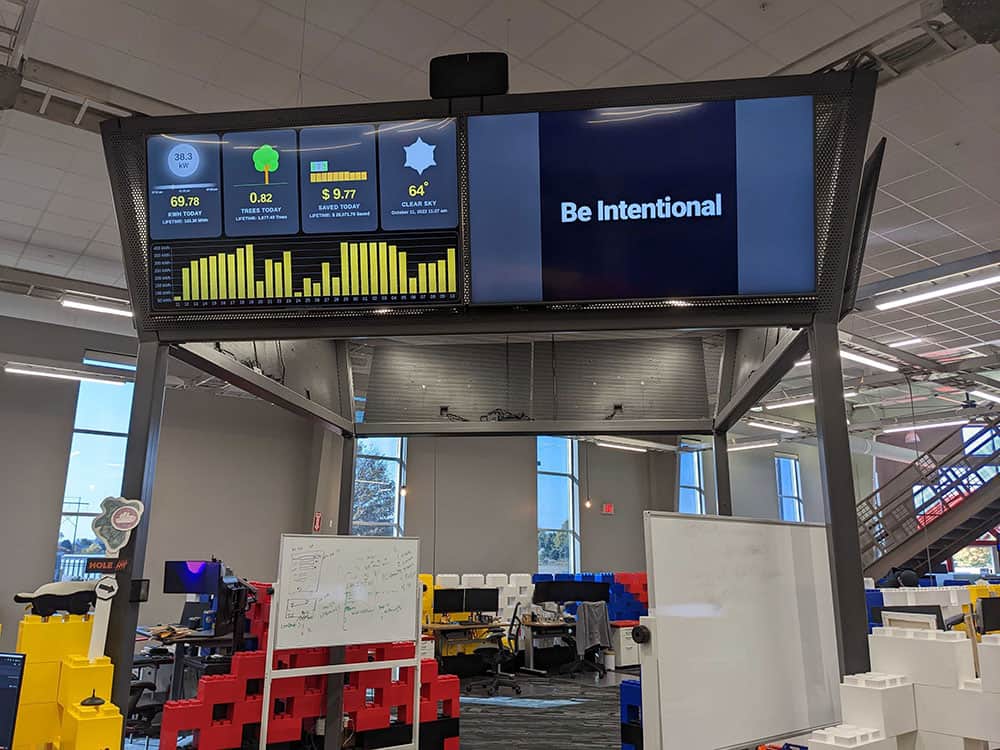
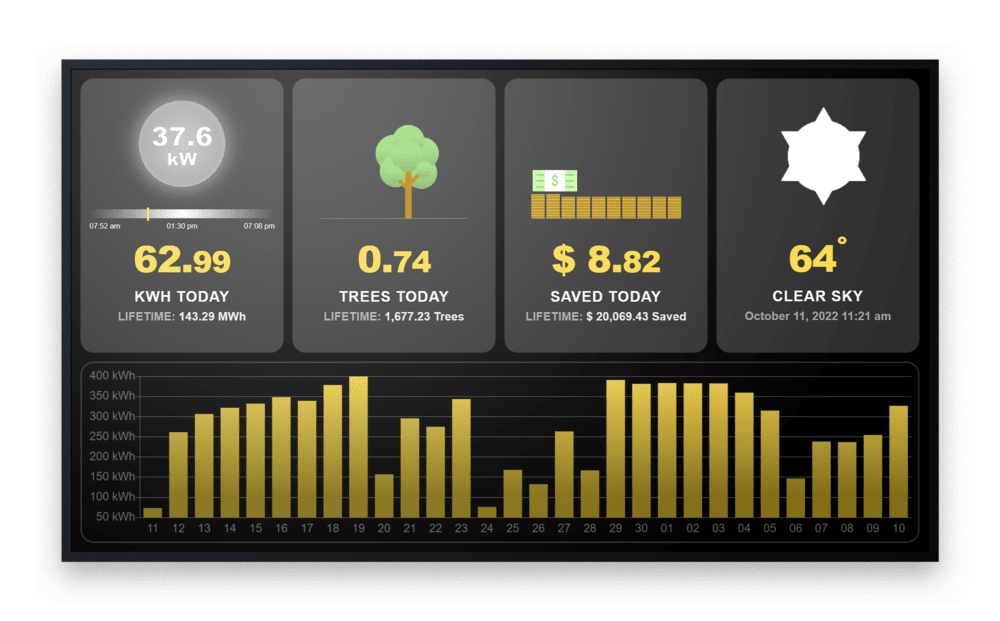
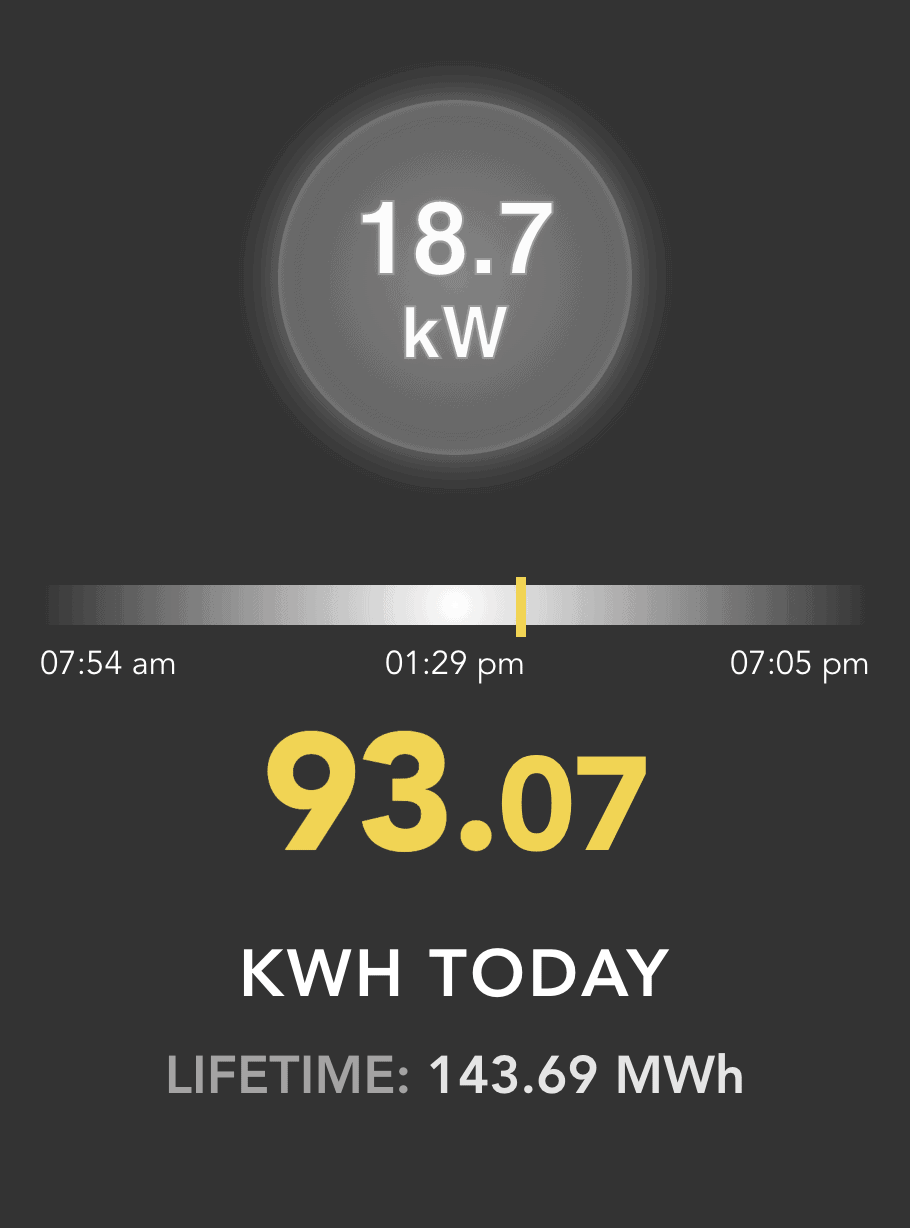
Ever since we had solar panels installed we wanted to do something interesting with the data we were collecting. So we harnessed our internal skills to put together a real-time dashboard that’s a useful and fun way to visualize the benefits we’ve gained since going solar.

We love to make cool things with cool people. Have a project you’d like to collaborate on? Let’s chat!
Stay up to date on what BizStream is doing and keep in the loop on the latest in marketing & technology.